Budget cuts – a phrase no one, whether you are from a multi-million dollar company or a small local shop, ever wants to hear. When unprecedented factors like we are experiencing today cause resources to be taken away or redistributed for the sake of the company, it can be a hard pill to swallow; however, if marketing budget cuts are made using a data-driven method that stretches each dollar to its full potential, the hit on your marketing budget becomes manageable.
Below is Helium SEO’s step-by-step method to analyze the channels in which users are landing on your site vs. the cost-of-conversion between channels. We recommend cutting the highest cost per conversion tactics first and leaving the lowest cost per conversion tactics to be the very last thing you cut, as those are bringing you the newest conversions for the smallest dollar amount.
High vs. Low Funnel Marketing
The most important part of understanding the anatomy of your marketing budget is understanding where the dollars are truly going. Understanding the marketing funnel is the catalyst to gain this understanding.
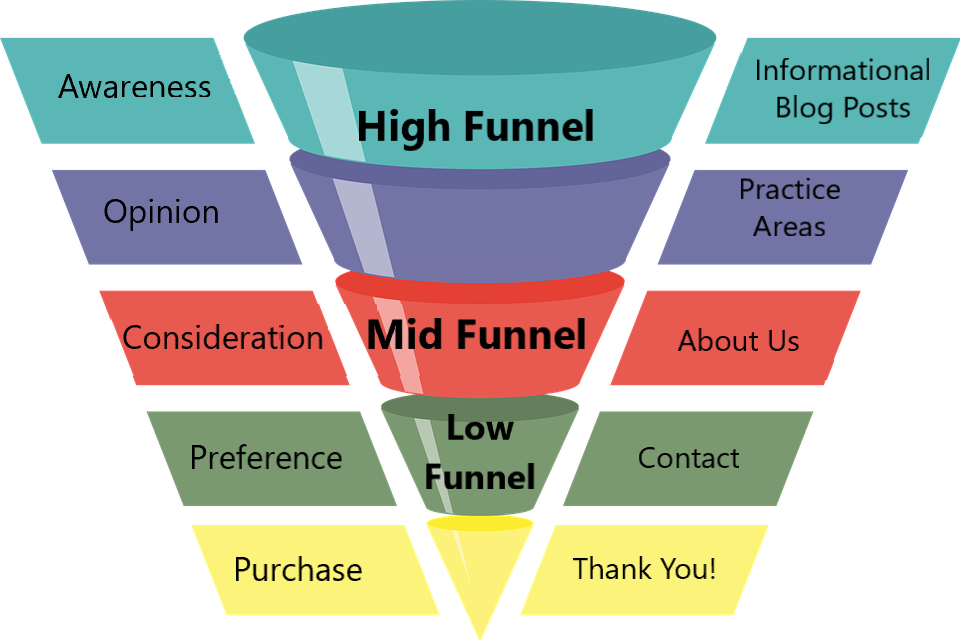
The graphic below from Mockingbird illustrates the various stages of the funnel:

High Funnel: Awareness Marketing
- TV, Radio, Billboards, Bus Wraps, Print Marketing, Spotify, Podcasts
- These are the dollars that you are spending to spread awareness of your brand. This is essentially casting out a very large net and hoping you are able to bring fish in.
- The cons are that this is the most expensive form of marketing and the conversion rate is not easily measurable.
- It is important to understand that spending marketing dollars on awareness tactics will improve your sales in 6-15 months, but rarely drives immediate sales increases. Instead, it increases customer’s TOMA (top of mind awareness) about your product or brand, leading them to trust you down the road.
Low Funnel: Consideration
- PPC Ads, SEM, SEO, Webinars, Demos, Free Downloads, White Papers, Customer success videos, Paid Social, etc.
- These are dollars you are spending that are closest to actual paying customers. At this stage the prospect knows about your brand, they are considering their options, weighing different products, and searching for solutions.
- These dollars typically have the highest ROI of any marketing spend because they result in direct sales to your company.
- They are the easiest to measure, easiest to track, and improvement can show immediate impact.
The difference between High Funnel and Low Funnel Marketing
We want to focus on one key difference between these two types of marketing: target audience.
High funnel marketing is great, and it works, but in a time when the budget is tight for many businesses a more targeted approach in marketing is needed to ensure that the money you spend is being directed towards potential consumers that are ready to purchase your product or service. Focusing lower in the funnel when people are considering a purchase allows you to shorten the purchasing and sales cycles in order to gain more new business.
Cost-of-Conversion Analysis
The following will be a step-by-step process showing how to view and analyze conversion cost through Google Analytics. If you do not have Google Analytics tracking your site metrics, traffic, and conversions, follow these set-up instructions.
Step 1:
The first step is simply getting in the right place to find the data. To find all channels of traffic you will need to go to the left side of the Analytics screen and click Acquisition > All Traffic > Source Medium.
Step 2:
Now that you are in the right place, the second step is adjusting the time period of the data. The image below will show data from the beginning of 2020 until now. You will want to make sure that the time period you are analyzing is large enough to gather enough data to make an educated decision. We recommend at least 3 months.
Step 3:
Now, it’s time to dive into the data. Below is a screenshot from one of our clients that we are going to be using as a model:
The column “Conversion Rate” is where you will want to hone in to find your top channels that are driving conversions. In the above image, you will see that “google/organic” and “google/cpc” are two of the three main conversion driving channels.
So, what causes that traffic to land on your site and convert?
Google / organic
Users search a term in Google, your website populates in the results, they visit your site and convert.
Ranking keywords on page one is vital to increasing organic traffic, and a strong SEO campaign is the only way to increase rankings.
Google / CPC
This is an SEM (Search Engine Marketing) visitor that searches a term in Google, sees your ad snippet at the top of the results, visits your site and converts.
SEM is a surefire way to target your industry-related keywords to generate new users landing on your site, and the more visitors means increased conversions.
Step 4:
Run the numbers. I know math may not have been your favorite subject in school, but this math should be pretty simple to figure out. Take the budget you are spending on any marketing tactic, and divide it by the amount of conversions it drove in the last 30 days, and you will have your cost/conversion. That formula is:
$ spent in last 30 days / # of conversions = Cost per conversion
For the example above let’s assume the company is spending $4000/mo on Google Organic and $10,000 per month on Google CPC. If we run the math we would get:
Google CPC: $10,000 / 9713 = $1.03 / conversion
Google Organic: $4,000 / 33,177 = $0.12 / conversion
So in this scenario, this company is paying almost 9X more money for a conversion from Google CPC than they are from Google Organic. In this case, our recommendation to the client would be to reduce their Adwords spend to as little as possible before cutting any of their Organic spend because the conversions are so much cheaper from organic. Does that make sense?
You can do this with your awareness marketing budgets too. We recommend setting a KPI for each awareness tactic and then measure your cost / KPI just like your cost/conversion. If you are running TV ads and you expect to get 1 Million views for a $50,000 flight, your cost / KPI would be $0.05 for every view.
If you attend trade shows your KPI should be the amount of leads generated at the show, divided by the total cost of the show attendance. This allows you to generate a reasonable ROI of what the trade show is producing for your business.
Step 5:
This is where you make the decisions. By determining which marketing channel is bringing in the largest number of conversions with the highest conversion rates, you are able to see where you should be investing your marketing dollars in order to see the highest return.
The channels that aren’t producing good quality leads or sales are the ones that you can look into cutting temporarily to ensure you are getting the most out of your marketing spend.
We would also recommend that when business is slow, to invest as many of your dollars into the lowest funnel activities you can because they are most likely to generate new revenue for you. We would recommend cutting branding, awareness marketing, Radio/TV/Print, Organic Social far before cutting the low funnel activities that are driving the leads and sales to your company.
Let’s Keep Moving Forward – Together
We understand that COVID-19 has had an unprecedented level of disruption on the economy and local businesses and that more than likely your business (like ours) has been negatively affected. It is our hope at Helium that the information above provides insight into the best way to approach marketing budget cuts and adds value to your team and business. If you would like to learn more or dive into greater detail, drop us a line and we would love to connect.
Stay in, stay healthy, stay close to your loved ones, and keep crushing it!


